
Understanding the Business Model Canvas
What is the Business Model Canvas?
Why use the Canvas in Discover?
When should your team use it?
How to get started
Using the Canvas with a team
The nine parts of the Canvas
Step back and analyze the whole Canvas
From Canvas to data project
BUAN capstone checkpoint
Appendix A: Blank Business Model Canvas
1. What Is the Business Model Canvas?
A surprising number of data projects begin with a dataset instead of a business problem. Someone hands you a spreadsheet and asks what you can find. A manager wants a dashboard. A team wants to know why sales are down, customers are leaving, deliveries are late, or employees are quitting. The request sounds specific, so everyone starts looking at the data.
Before you do that, you need some idea of how the business actually works. Customers buy something. Employees do work. Suppliers provide things. Money comes in. Costs go out. Somewhere in the middle, information moves through systems and eventually becomes reports, measures, forecasts, recommendations, and decisions.
A business model describes how an organization creates value, delivers it to the people it serves, and supports the work required to keep doing it.
The Business Model Canvas gives you a way to put the important parts of that model on one page so you can see how they connect. For a data project, that is useful because you are not trying to become an expert on the organization before you begin. You are trying to understand enough of the system around the data to ask a responsible question about it.
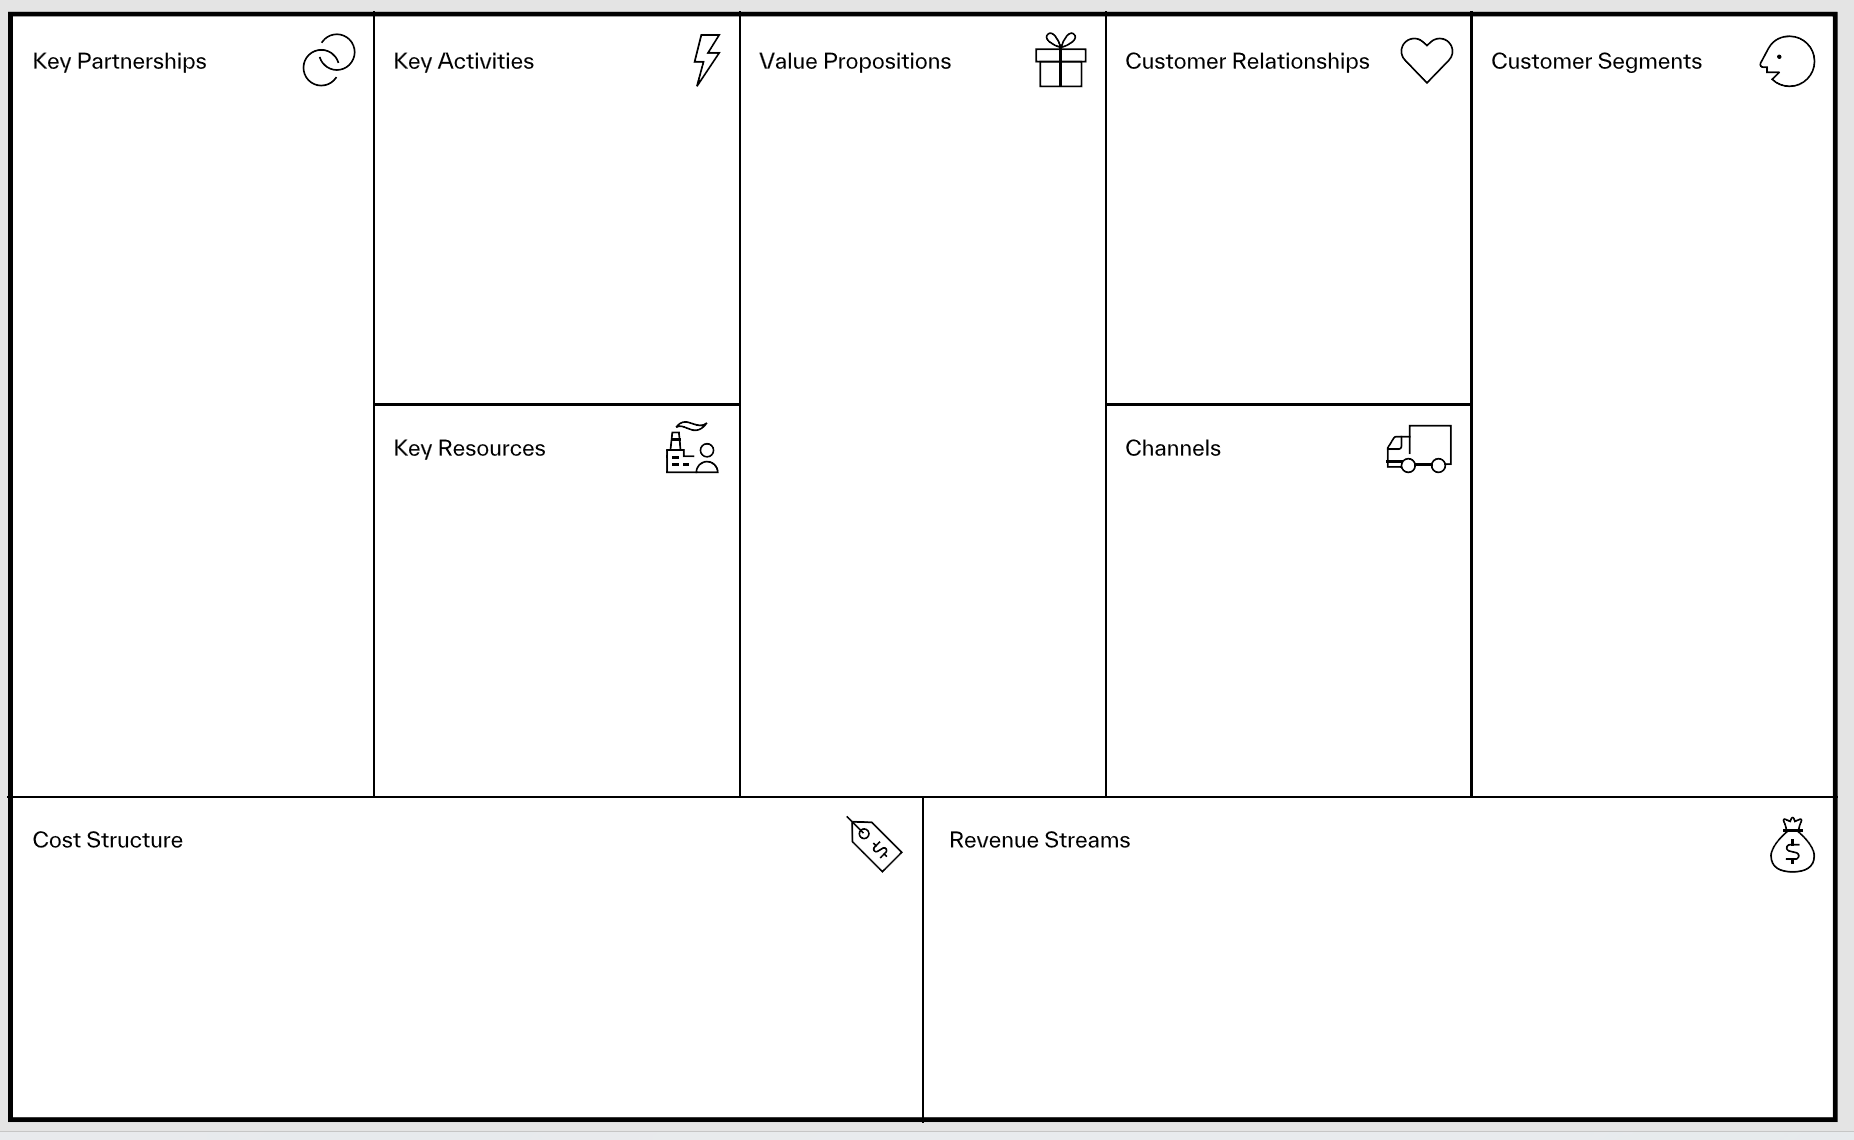
IMAGE of the Business Model Canvas, available through SCORE
Remember
Every row in a dataset began as something that happened. A sale, a registration, a shipment, a complaint, a payment, a shift, or a service request may later become data. The Canvas helps you see the business activity behind the data.
2. Why Use the Canvas in Discover?
The short answer is that the Canvas makes a complicated business easier to see.
Organizations contain customers, employees, suppliers, technologies, processes, costs, revenue, information, and competing priorities. Those things are connected, but they are rarely described in one place. Different people inside the same organization may understand only the part closest to their own work.
The Canvas forces much of that complexity onto a single page. That gives your team three useful things: focus, transparency, and flexibility.
Focus: You cannot analyze everything about a business at once. The Canvas helps you identify who the organization serves, what value it provides, how that value is delivered, and what work, resources, partners, revenue, and costs support it.
Transparency: Putting assumptions in one place makes disagreement easier to discuss. One person may believe customers choose the organization because it is inexpensive. Another may believe they choose it because it is convenient. A third may think service is the differentiator. The Canvas makes those differences visible.
Flexibility: The first version will probably be incomplete. That is not a defect. A useful Canvas should be revised when evidence changes your understanding of customers, costs, partners, processes, or the problem itself.
In Discover, the Canvas helps your team avoid a common mistake: defining an analytics project before you understand the organization well enough to know what the analysis is for.
3. When Should Your Team Use It?
Use the Canvas when you need a focused conversation about how a business, service, program, or line of business actually works.
It is often associated with startups, but in this course it is especially useful for understanding an existing organization. Your cases will not always explain the business context in the way an experienced employee might understand it. The Canvas gives your team a simple way to build that context.
Use it when you are trying to answer questions such as:
Who is this organization serving?
What problem does it believe it is solving for them?
How does the organization create, deliver, and sustain value?
What activities and resources are essential to that value?
Where does the organization depend on partners or systems it does not fully control?
What drives revenue and cost?
Where might better information change a decision?
Think of it as a map you draw before deciding where to investigate.
4. How to Get Started
Start with a blank Canvas and treat the first pass as a sketch, not a test. Put down what you currently believe about the organization. Keep the entries short enough that you can see relationships across the page. If you are uncertain about something, mark the uncertainty rather than inventing an answer.
For a case-based project, use the evidence available to you: the case description, data documentation, reports, interview excerpts, process descriptions, and other case materials. If a box is difficult to complete, that is useful information. It may tell you what to investigate.
You don't need to fill out the Canvas perfectly in numerical order. For this course, begin with Customer Segments and Value Propositions, because you first need to understand who is being served and what the organization believes it is doing for them. Then follow that value through Channels and Customer Relationships before turning to the activities, resources, partners, revenue, and costs that make the model possible.
Working rule
Your first Canvas should look provisional. That is the point.
Provisional means honestly uncertain, not incomplete. Every box should still reflect your best attempt using the evidence available to you — mark what you are unsure about, but do not leave a box blank because you have not investigated it yet. A Canvas that looks tentative because you were honest about uncertainty is doing its job; one that looks tentative because you did not do the work is not.
Applying It In Practice: Getting Started
Understanding what each box means is one thing; actually using the canvas is another. The first time through, keep it low-stakes: print it out or draw it on a larger piece of paper. Once you're ready to build something more polished (i.e., for sharing, presenting, or handing off), switch to the digital version: a Google Slides template you can copy directly, or download as a blank editable file from SCORE.
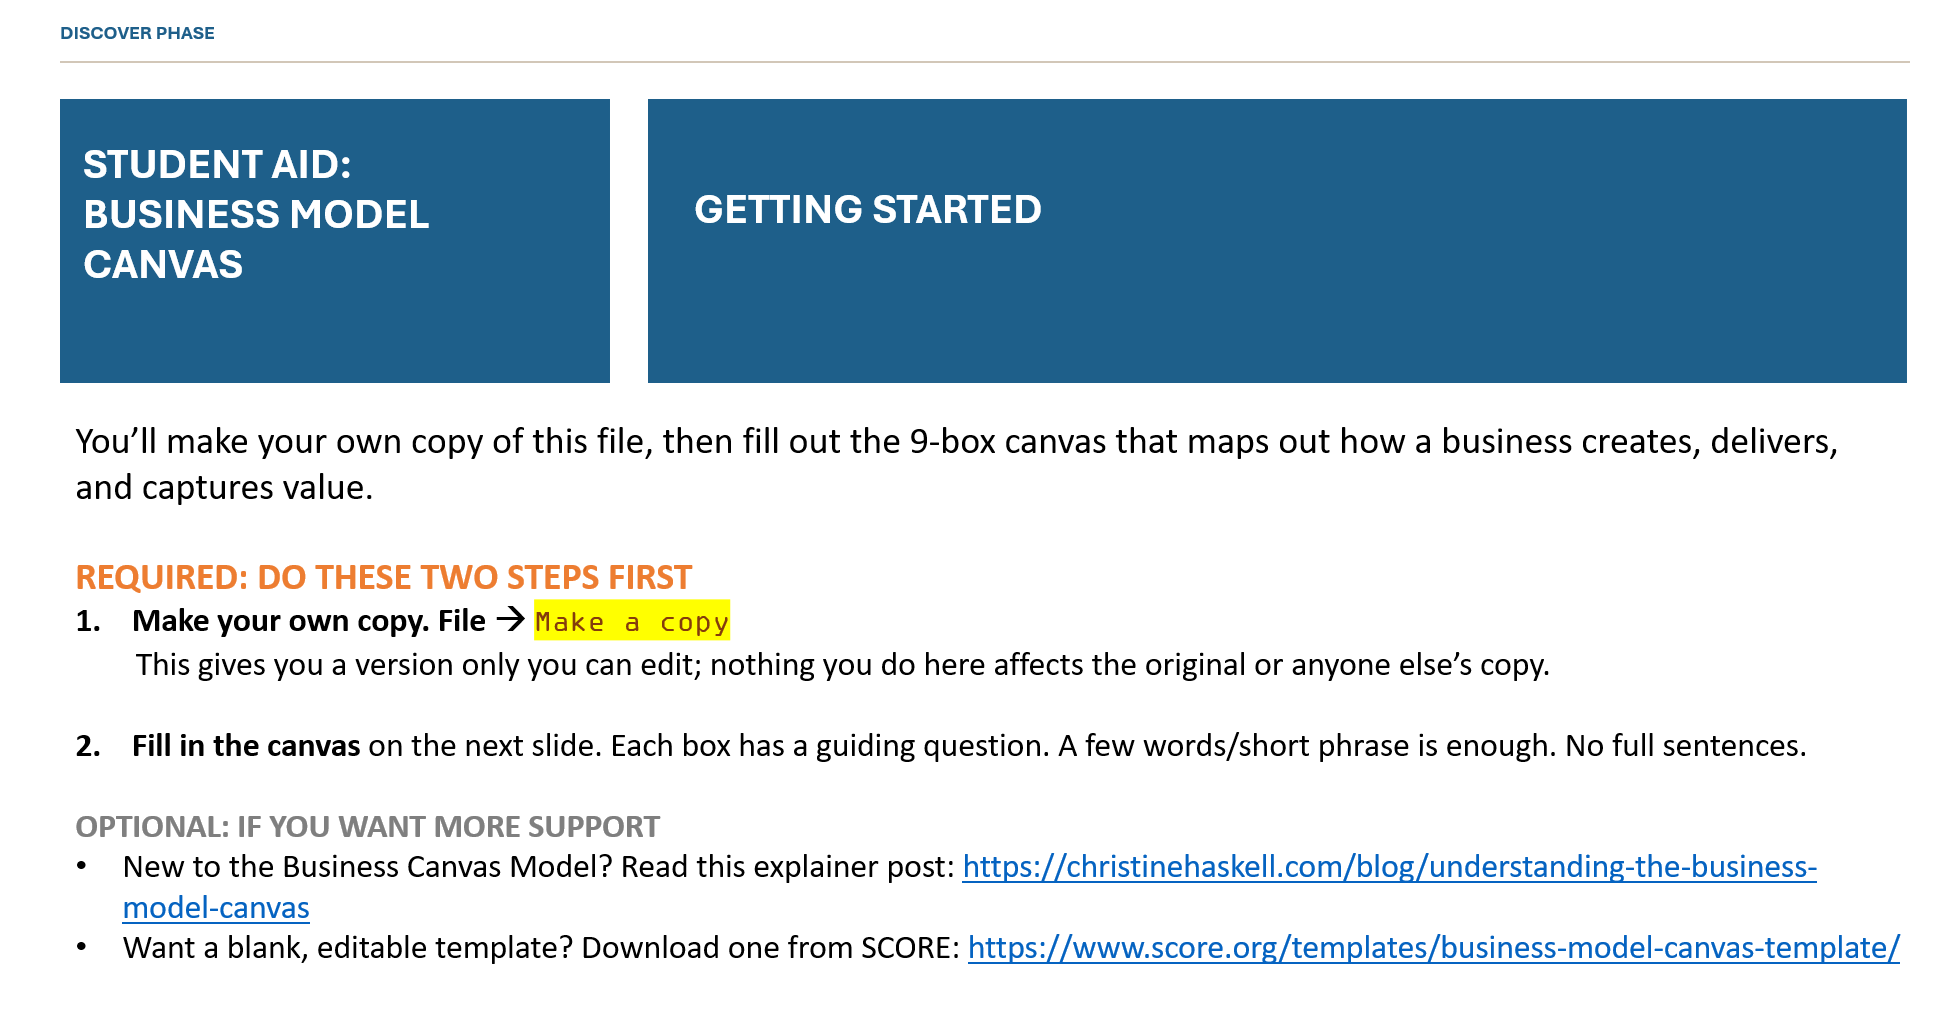
5. Using the Canvas With a Team
The Canvas is especially useful when several people understand the same business from different vantage points.
If one team member believes convenience is the main reason customers choose the organization and another thinks it is price, do not rush to combine those answers into something vague enough that everyone can agree. Ask what evidence supports each interpretation.
The same principle applies throughout the Canvas. Mark down what you know, what you assume, and what you still need to investigate.
Alignment does not mean instant agreement
Alignment means developing a shared enough understanding of the business to know where the important questions and uncertainties are.
6. The Nine Parts of the Canvas
The Business Model Canvas breaks the larger business system into nine areas. Do not treat the boxes as independent worksheets. They describe relationships inside the business. As you fill them in, keep asking how one box affects another.
Step 1: Customer Segments - Who Are We Serving?
Every organization serves someone. A coffee shop serves people who want coffee or food. An airline serves travelers. A university serves students, but it may also serve employers, donors, research partners, government agencies, and communities around it.
A customer segment is a group of people or organizations that share characteristics that matter to the business. Segments may use different services, respond to different offers, create different costs, and raise different business questions.
Sometimes you need to get closer than a broad segment. A persona is a concrete representation of a kind of person within a segment. It helps you think about that person’s circumstances, needs, habits, motivations, and alternatives. Use a persona only if it helps your team reason about the problem, the data, or the decision.
Also remember that the user, buyer, payer, beneficiary, and decision-maker may not be the same person. A student may use an educational service while a parent, employer, financial-aid source, or government program pays for part of it. An employee may use software while procurement buys it.
Waypoint Coffee example
Segment: Seattle University students.
Persona if useful: Maya, a commuter student who arrives at 8:30 and has ten minutes before class. Speed and predictability matter more to her than menu variety.
Before you move on, ask:
Who uses, buys, pays for, benefits from, or decides about this product or service?
What are these groups trying to accomplish?
What are they doing now instead?
Who is represented in the data, and who might be missing?
Step 2: Value Propositions - Why Would Anyone Choose This?
A Value Proposition describes the reason a customer would choose this organization, product, or service instead of doing something else.
Notice the phrase instead of doing something else. A coffee shop competes with another coffee shop, but it also competes with making coffee at home, drinking free coffee at work, buying an energy drink, or skipping coffee altogether.
Customer Segments and Value Propositions have to make sense as a pair. Different customers may value different things. The useful question is not merely “What value do we provide?” It is “Value for whom?”
This matters in analytics. The data can tell you what happened. The business model helps you understand why it might matter.
Waypoint Coffee example
Maya may value speed and location. A graduate student working for two hours may value seating, Wi-Fi, outlets, and an environment where they can stay awhile.
Before you move on, ask:
What problem or need does the organization address?
What current alternative is the customer comparing it with?
Which value proposition matters to which segment or persona?
If the value proposition fails, what data might show that?
Step 3: Channels - How Does the Customer Get There?
A Channel is a way the organization reaches the customer. This can include how people first hear about the organization, how they buy something, how the product or service is delivered, how they begin using it, and how they receive support afterward.
For a simple Canvas, think about four moments: awareness, purchase or access, delivery or onboarding, and support or retention.
Channels matter for data because different parts of the customer journey may be recorded in different systems or owned by different partners. A simple question such as “Why are customers unhappy with delivery?” becomes more complex when the restaurant, delivery platform, payment processor, and customer each see different parts of the experience.
Waypoint Coffee example
A student may hear about the coffee shop from a friend, order at the counter, pay through the POS system, receive a loyalty stamp, and later see an Instagram update.
Before you move on, ask:
How does the customer find out about, access, receive, and get support for the product or service?
Where does the organization directly touch the customer?
Where does another system or partner control part of the experience?
What data are created at each point?
Step 4: Customer Relationships - What Kind of Relationship Exists Over Time?
Customer Relationships describe how the organization interacts with customers over time. Some relationships are personal. Some are automated. Many combine both.
Two questions are useful: Can the organization actually deliver its value proposition through this relationship? What does maintaining this relationship require?
For analysts, the relationship also raises questions about what it captures and what it misses. If a company measures satisfaction only after successful online transactions, it may miss people who became frustrated and left before completing one.
Waypoint Coffee example
Waypoint Coffee may have quick counter service, a loyalty card, social media updates, and occasional complaint handling by the manager.
Before you move on, ask:
Is the relationship personal, automated, self-service, ongoing, transactional, or some combination?
Can this relationship deliver the value proposition?
What does the relationship cost to maintain?
Whose experience may be invisible in the data?
Step 5: Revenue Streams - Where Does the Money Come From?
A Revenue Stream describes how money comes into the organization. For a coffee shop, customers buy drinks and food. For other organizations, revenue may include subscriptions, advertising, grants, public funding, gifts, fees, or transaction percentages.
Some organizations involve multiple groups, and one group may subsidize another. On many online platforms, users receive the service while advertisers provide much of the revenue.
At this point, link three parts of the Canvas: Customer Segment -> Value Proposition -> Revenue Stream. Who receives the value? What value matters to them? How, if at all, does that relationship generate revenue?
Numbers become meaningful in context. A 5 percent drop in one customer segment may be minor. A 5 percent drop in the segment responsible for half the organization’s revenue is something else entirely.
Waypoint Coffee example
Revenue may come from coffee, tea, pastries, sandwiches, and possibly catering or pre-orders for campus events.
Before you move on, ask:
Who pays?
What do they pay for?
Which customer segments are connected to which revenue streams?
How might the revenue model affect what the organization prioritizes?
Pause: Look at the Customer Side
At this point, you have worked through Customer Segments, Value Propositions, Channels, Customer Relationships, and Revenue Streams. Together, these describe much of the outward-facing side of the business. Before moving behind the scenes, ask whether those pieces make sense together. If they do not, the inconsistency may itself be important
Step 6: Key Activities - What Does the Organization Actually Have to Do?
Every organization does hundreds of things. Key Activities are the activities that matter most to making its business model work. They are the work the organization has to perform reliably in order to deliver its value proposition to the people it serves.
The point is not to list everything the organization does. The point is to identify the work that is especially important to delivering the value proposition.
This is also where the connection to data starts to become visible. Business activities produce events, and many of those events leave records behind. A customer places an order, and the point-of-sale system records a transaction. A shipment arrives and inventory changes. A student registers for a course, and an enrollment system records the registration.
In Driving Data Projects, the data supply chain is Acquisition -> Transformation -> Consumption. The business activity itself comes before that chain. Something happens in the organization and, if it is captured, becomes source data.
Waypoint Coffee example
Customer buys a latte -> POS records the sale -> transaction data are acquired -> sales are cleaned and grouped by hour -> a manager reviews the pattern and adjusts staffing.
Before you move on, ask:
What work has to happen for the organization to deliver what it promises?
Which activities are truly central to that promise?
What records or data traces does that work create or fail to create?
Step 7: Key Resources - What Does the Organization Need?
Key Resources are the assets and capabilities the organization depends on in order to perform its Key Activities and deliver its Value Proposition.
Some resources are physical: buildings, equipment, vehicles, warehouses, or factories. Some are financial. Some are intellectual: brand reputation, specialized knowledge, proprietary processes, or patents. Some are human: people with particular expertise or experience. Increasingly, some are informational. Data can itself be a Key Resource.
The useful distinction is between a resource that is merely helpful and one the business really depends on.
Waypoint Coffee example
The coffee shop depends on baristas, ingredients, espresso equipment, a campus location, a POS system, and inventory information.
Before you move on, ask:
What resources do you need to perform the key activities?
Which resources matter to the problem your team is studying?
Are any required data incomplete, inaccessible, poorly defined, or owned elsewhere?
Step 8: Key Partnerships - Who Else Does the Business Depend On?
Very few organizations do everything themselves. A Key Partner is another organization or group the business relies on to perform important parts of its model.
Do not simply list every organization the business has ever dealt with. Ask what important activity or resource the partner provides, and why the organization depends on them rather than doing it itself.
Partners create dependencies. If something important happens outside the organization, the organization may have limited control over it. They also complicate data.
Waypoint Coffee example
The coffee shop may depend on a coffee roaster, bakery, dairy supplier, payment processor, campus facilities, and delivery or ordering platforms.
Before you move on, ask:
Which partners perform important activities or provide important resources?
Which parts of the problem are controlled by the organization, and which depend on someone else?
What data gaps may appear because a partner controls part of the process?
Step 9: Cost Structure - What Does All of This Cost?
Cost Structure connects costs to the activities and resources required to deliver the organization’s value proposition.
Some costs are relatively fixed. Rent on a building may stay roughly the same whether the coffee shop sells 300 or 500 drinks. Other costs are more variable. Selling more drinks requires more coffee, milk, cups, and perhaps more employee hours.
You do not need to become an accountant to use the Canvas. You do need enough business context to recognize that changing an outcome usually requires something.
Analytics can help identify what appears likely to improve an outcome. Business judgment requires asking whether the proposed action is feasible, sustainable, and worth what it requires.
Waypoint Coffee example
If the team recommends reducing morning wait times by adding staff, the recommendation has a labor-cost implication. If it recommends a mobile pre-order system, there are technology, training, and support costs.
Before you move on, ask:
Which key activities and resources drive the major costs?
Which costs are fixed and which vary with volume?
What would happen to costs if the organization acted on your recommendation?
Could a technically attractive recommendation be too expensive, labor-intensive, or risky to implement?
7. Step Back and Analyze the Whole Canvas
Once you've worked through all nine areas, step away from the boxes. The interesting question is no longer whether every box has something in it. It is whether the business model makes sense as a system.
Does the Value Proposition actually address something important to the customer?
Are different Value Propositions connected to the right Customer Segments?
Do the Channels and Customer Relationships support that promise?
Can the Key Activities actually deliver it?
Do the organization and its partners have the necessary resources?
Do the Revenue Streams and Cost Structure make sense together?
Where are the tensions, assumptions, fragile points, and disagreements?
Where could data help us understand something important about this system
8. From Canvas to Data Project
The Business Model Canvas is not the analytics project. It gives you the context for the analytics project.
During Discover, the Canvas helps you move toward a better Design phase. It should help your team explain the problem, the people involved, the decision context, the evidence needed, and the likely scope of the project.
As you work through the Canvas, begin adding a second layer. For each important activity, ask:
What data are created here?
Who or what creates them?
Where are they stored?
What happens to them next?
What might not be captured?
Who eventually uses the resulting information?
What decision might follow?
Data-Project bridge
Business activity -> source data -> Acquisition -> Transformation -> Consumption -> decision
Each arrow is a place where something can be lost, delayed, or distorted before it ever reaches your analysis. If you can name what actually happens at each step for your case, you can also name where your data might be incomplete, late, or already transformed in a way that affects what you can responsibly conclude from it.
9. BUAN Capstone Checkpoint
For the capstone, your completed Canvas should help your team enter Design with a better project question. It should not turn you into an expert on the organization, and it should not become a decorative appendix. Use it.
Before your team formalizes its analytics question, you should be able to explain:
who the organization serves and what those people need;
what the organization is trying to provide;
how that value is delivered;
which activities, resources, and partners matter to the problem;
how the organization earns money or sustains the work;
where important costs or constraints appear;
where relevant data may be created
and where your proposed analysis fits into the larger system.
What to update after completing this aid
Update the Project Charter with the selected problem, decision owner, formal analytics question, evidence check, scope, and project success criteria. Update the Development Journal with assumptions, evidence gaps, and what changed in your understanding.
One Last Thing: The Canvas Is a Draft
Do not become too attached to your first Canvas. You are creating a working representation of the organization based on what you know right now. Some of it will be incomplete. Some of it may be wrong.
Putting your assumptions on one page makes them visible enough to discuss, challenge, and revise. So revisit it on purpose, not only when something feels off. Come back to the Canvas when the Data Availability Note tells you a resource, record, or field you were counting on does not exist, or exists in a different form than you assumed. Come back when the Exhibits Packet introduces a partner, cost, or customer segment your first pass did not account for. Come back if your own analysis contradicts a Value Proposition or Revenue Stream you had treated as settled. Each of those is a concrete reason to open the Canvas again — not just a general sense that you have “learned more.”
The Canvas is not the result, and it is not the final answer. It is a way to get enough of the business into view that you can start asking better questions of the data.